Siting a National Data Center
|
The paper below describes a site selection analysis performed by Edgetech America, Inc. and Dewberry & Davis. It was presented at the 1998 Virginia GIS Conference.
Abstract
The United States Immigration and Naturalization Service (INS) is maintaining active paper records on over 26 million individuals. As part of its modernization strategy, the INS evaluated centralizing all these records, which are currently kept in 80 locations across the country into a single facility. Dewberry & Davis and Edgetech America, Inc. developed a short list, for INS senior management and eventually the U.S. Congress, of the best and safest facility locations.
This paper describes the site selection process from establishing the selection criteria to searching trusted data sets and performing the analysis itself. It also evaluates the ability of ArcView to perform the analysis and offers suggestions for improving the software.
Introduction
In the Spring of 1997, Denis Roose, President of Edgetech America, was asked to support Dewberry & Davis with its INS Centralized Records Management Facility siting analysis. Dewberry & Davis is the largest civil engineering company based in Virginia, USA. Edgetech America, Inc. is a small Esri Business Partner with extensive experience in GIS, economic development and site selection.
The Start-up Situation
The U.S. Immigration and Naturalization Service (INS) was investigating the feasibility of centralizing its 80 records management facilities in one location. These facilities manage the paper records of over 26 million people with U.S. residency status, immigrating to, or being naturalized in, the U.S.
These records are considered active in that they should all be deliverable to a court or other institution overnight. It is the INS's responsibility to manage them until they become inactive and are sent to the National Archive Centers for storage. In the Spring of 1997, the INS was in the process of modernizing its operations to improve the safeguard, delivery and overall management of these records. It had identified at least two ways to achieve this: by digitizing the records and by centralizing its 80 regional record management centers.
The proposed central office would take over all the current record management activities and digitize the existing records within three years of operation.
Siting Requirements
The Centralized Records Management Facility would require 300,000 square feet of space, a large portion of which would be used for warehousing paper records. The INS was amenable to moving to an existing facility or building a new one.
At first, the Center would employ 400 people. This number would decline by half, following the three-year digitization period. The required educational level of most workers would be a high-school degree or slightly above.
Because of the records' legal nature and uniqueness, it is paramount that their physical condition be kept intact for the long term and that they be quickly accessible and deliverable to anywhere in the USA.
The INS identified the labor force as being the highest cost of operating such a facility. Other important operating costs included the delivery of the records, utilities and the lease or ownership of the facility.
The transition to the centralized facility would also be costly, primarily because it involved moving all the records and potentially relocating managers and training new workers.
Dewberry & Davis and Edgetech America had one month to complete the site selection analysis from notification to final delivery.
Methodology
Due to the short time allocated to this study and its political sensitivity, it was decided that the analysis would be county-based and would use federal government data to the extent possible. Over fifty data layers (criteria) were investigated. An on-site study would take place after this analysis to verify findings and refine the analysis to the sub-county level.
The methodology would also be kept simple and would contain two major steps:
Tier 1 criteria involved:
Tier 2 criteria involved:
Each criteria was assessed utilizing specially measurable indicators. Data were collected and analyzed for each indicator.
Tier 1 Indicators & Measures
| Criteria | Indicator | Measure |
| Natural Hazards* | Earthquakes | Seismic Coefficient < 0.1 |
| Hurricanes | Wind Speed Between 1986-1996 < 90 mph | |
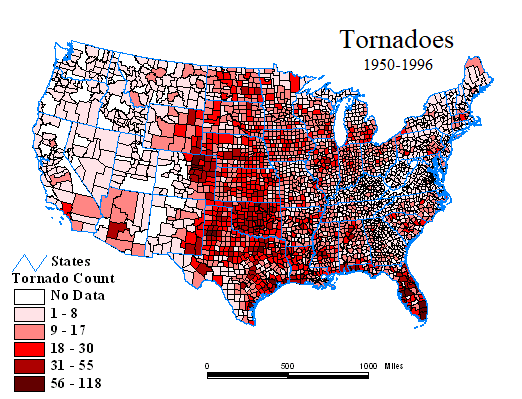
| Tornado | Tornado Count Between 1950-1996 < 31 | |
| Flood Proneness | Percentage of County in 100-Year Flood Zone < 33% | |
| Transportation | Airport Proximity | Areas within 35 miles of Commercial Airports |
| Interstate Highway Proximity | Areas within 10 miles of Interstate Highways | |
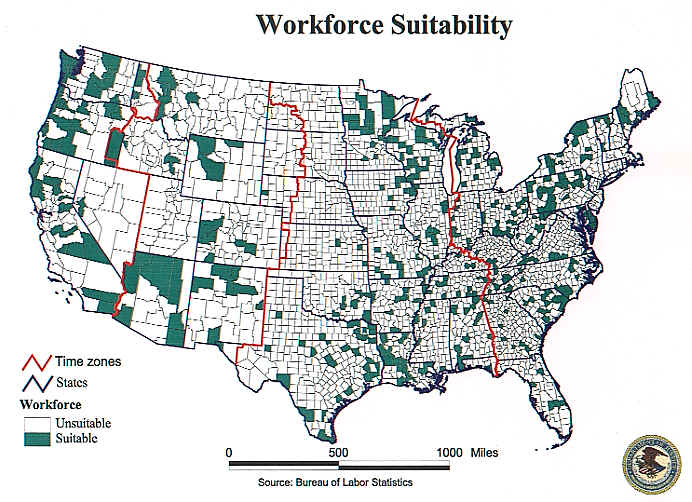
| Workforce Suitability | Availability of Qualified Workforce | Total Number of High School "Plus" Graduates * 5% > 400 |
| Unemployment | Unemployment Rate >= 5% | |
| Cost of Labor | 1990 Annual Wages < $21,000 | |
| Growth of the Workforce | 1990-96 Labor Force Change > 0% | |
| Telecommunications | Internet Fiber Optic Network** | Areas within a distance from an Internet fiber optic network** |
* Winter conditions such as snow coverage and ice storms were not considered. It was argued that such conditions, in and of themselves, were not obstacles to running the Center appropriately. Community readiness to address winter conditions should be measured after the study on a case-by-case basis for the top candidate locations.
** At the time of the study, Internet Fiber Optic data was not available geographically and therefore this criteria was not taken into consideration in the final analysis.
Tier 2 Indicators, Measures & Weights
| Criteria | Indicator | Measure | Weight |
|
INS Regional and District Offices | Counties within 35 miles of existing INS Service Centers or Regional Offices | 8 points |
| Counties within 70 miles of existing INS Service Centers or Regional Offices | 4 points | ||
| Counties within 35 miles of District Centers | 4 points | ||
| Counties within 350 miles of existing Service Centers | 2 points | ||
| Cost of Living | Cost of Living | Every 5% under national average | 2 points |
| National average | 0 points | ||
| Every 5% above national average | -2 points | ||
| Related Federal Facilities | NARA Federal Records Centers | Counties within 70 miles of a NARA Federal Records Center | 2 points |
| Time Zones | Time Zones | Central Time Zone | 4 points |
| Mountain Time Zone | 4 points | ||
| Pacific Time Zone | 0 points | ||
| Eastern Time Zone | 0 points | ||
Analysis
About 40% of the counties were eliminated based on environmental risk indicators,
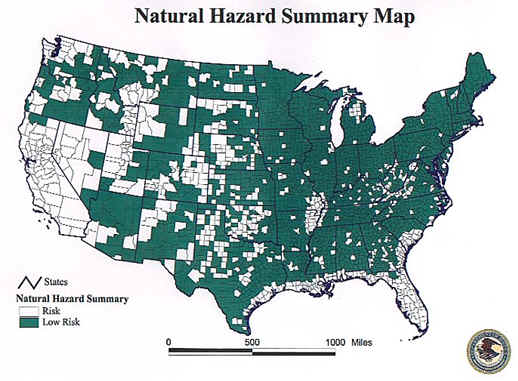
Most of the top 12 counties are in the Mid West.
Sample Maps
How Did ArcView GIS 3.0a Perform?
Overall, ArcView GIS performed very well. Its Graphical User Interface (GUI) made it possible to perform this extensive analysis, including researching the data, in just a month. Most data sets were delivered to us as county-based tables. It was easy to bring this information into ArcView using its "Join" button and append the data to the county shapefile delivered with ArcView.
ArcView could become even more functional if some of its Avenue functionality is exposed to the end user. For example, ArcView supports:
- Buffering, or
- The reordering of records on hard disk, or
- Intersecting themes.
But in ArcView 3.0a, this functionality is only available to programmers using Avenue. When a project has to be delivered quickly, this becomes an important obstacle. We would also like to see a TIGER conversion extension included with the software. We used the sample Projector extension often to project data sources in a common geographic reference system.
The ArcView project file (.apr) created for this project became rather large (25 Megabytes) taking several minutes to load. Loading time can be reduced by limiting the use of definition and selection sets as well as saving layouts in separate object databases or in separate .apr files. Snapshot layouts, those that are not hot-linked to views, greatly increase the size of the project file.
At the inception of this project, we considered using the ArcView Spatial Analyst extension. Raster-based GIS are very good at performing weighted analyses. While Spatial Analyst would have allowed a sub-county analysis to be performed to some extent. We decided not to use it. Even though Spatial Analyst may have broken down extremely large counties in the West, it would not have made a difference in the final result. Furthermore, INS Administrators and the U.S. Congress, our clients, are more familiar with political boundaries that they are with a matrix of raster cells. And as most of the data analyzed had been collected on a county basis, it is also more accurately communicated on a county basis.
Conclusion
Due to its built-in GUI, ArcView GIS was the appropriate Esri platform to perform this analysis. We were very pleased with its overall performance and identified a few areas where it could be improved.
The study was very well received by the INS. Although initially requesting a handful of copies of the report, the INS ultimately requested over 50 copies.
Acknowledgments
The author would like to thank Dewberry & Davis for giving him the opportunity to join its team and perform this very interesting siting study. The D&D team included Rob Dollison, Xiaoyi Zhang, Sue Hoegberg and Helen Malo. All made important contributions to the project.
Denis Roose
Edgetech America, Inc.
An Esri Business Partner
droose@edgetech-us.com
www.edgetech-us.com
Tel. 888-EDGETEC (334-3832)
© 1998 Edgetech America, Inc.
| Contact Us | Home | MapSpeller | Maps |
Copyright © 1997-2017. Edgetech America, Inc.